
NFL Stadium Funding Information
Stadiums Opened Since 1997
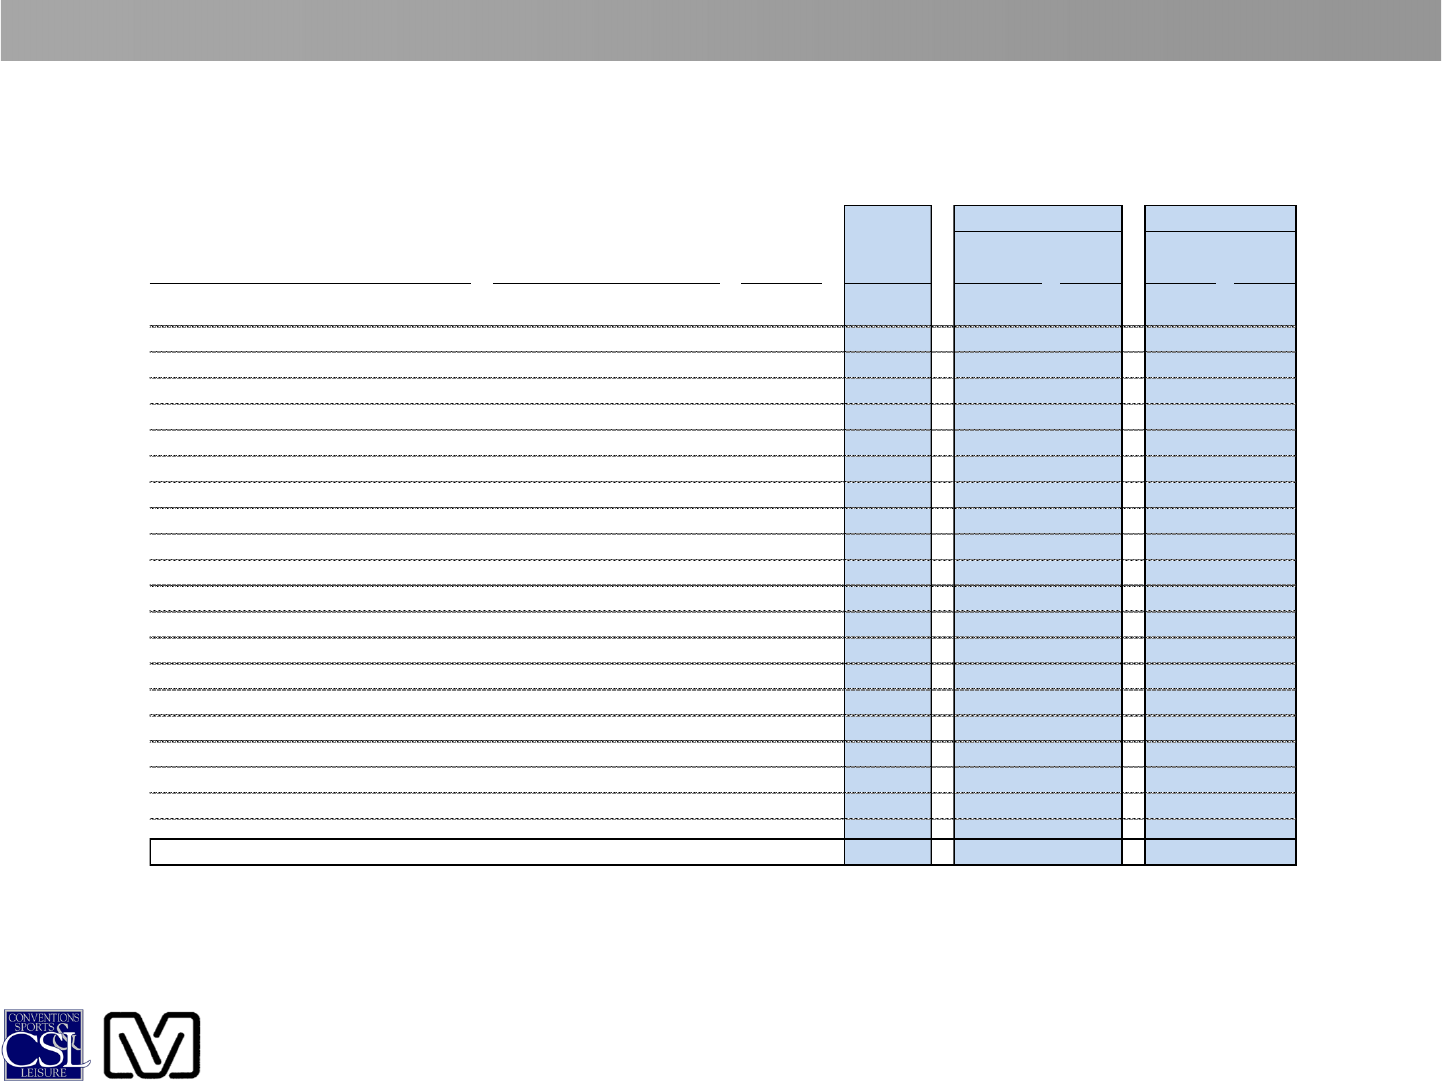
NFL STADIUM FUNDING INFORMATION
Total Private Funding Public Funding
Year Project Total % of Total % of
Stadium/Team Team Opened Cost Private Total Public Total
San Francisco 49ers (Proposed) San Francisco 49ers 2015 $987.0 $873.0 88% $114.0 12%
MetLife Stadium Giants/Jets 2010 $1,600.0 $1,600.0 100% $0.0 0%
Cowboys Stadium Dallas Cowboys 2009 $1,194.0 $750.0 63% $444.0 37%
Lucas Oil Stadium Indianapolis Colts 2008 $719.6 $100.0 14% $619.6 86%
University of Phoenix Stadium Arizona Cardinals 2006 $455.0 $147.0 32% $308.0 68%
Lincoln Financial Field Philadelphia Eagles 2003 $518.0 $330.0 64% $188.0 36%
Soldier Field (renovation) Chicago Bears 2003 $587.0 $200.0 34% $387.0 66%
Lambeau Field (renovation) Green Bay Packers 2003 $295.2 $126.1 43% $169.1 57%
Gillette Stadium New England Patriots 2002 $412.0 $340.0 83% $72.0 17%
Ford Field Detroit Lions 2002 $440.0 $330.0 75% $110.0 25%
Reliant Stadium Houston Texans 2002 $474.0 $185.0 39% $289.0 61%
CenturyLink Field Seattle Seahawks 2002 $461.3 $161.0 35% $300.3 65%
Heinz Field Pittsburgh Steelers 2001 $280.8 $109.2 39% $171.6 61%
Sports Authority Field at Mile High Denver Broncos 2001 $400.8 $111.8 28% $289.0 72%
Paul Brown Stadium Cincinnati Bengals 2000 $449.8 $25.0 6% $424.8 94%
LP Field Tennessee Titans 1999 $291.7 $84.8 29% $206.9 71%
Cleveland Browns Stadium Cleveland Browns 1999 $271.0 $71.0 26% $200.0 74%
M&T Bank Stadium Baltimore Ravens 1998 $226.0 $22.4 10% $203.6 90%
Raymond James Stadium Tampa Bay Buccaneers 1998 $194.0 $0.0 0% $194.0 100%
FedEx Field Washington Redskins 1997 $250.5 $180.0 72% $70.5 28%
Average $525.4 $287.3 44% $238.1 56%
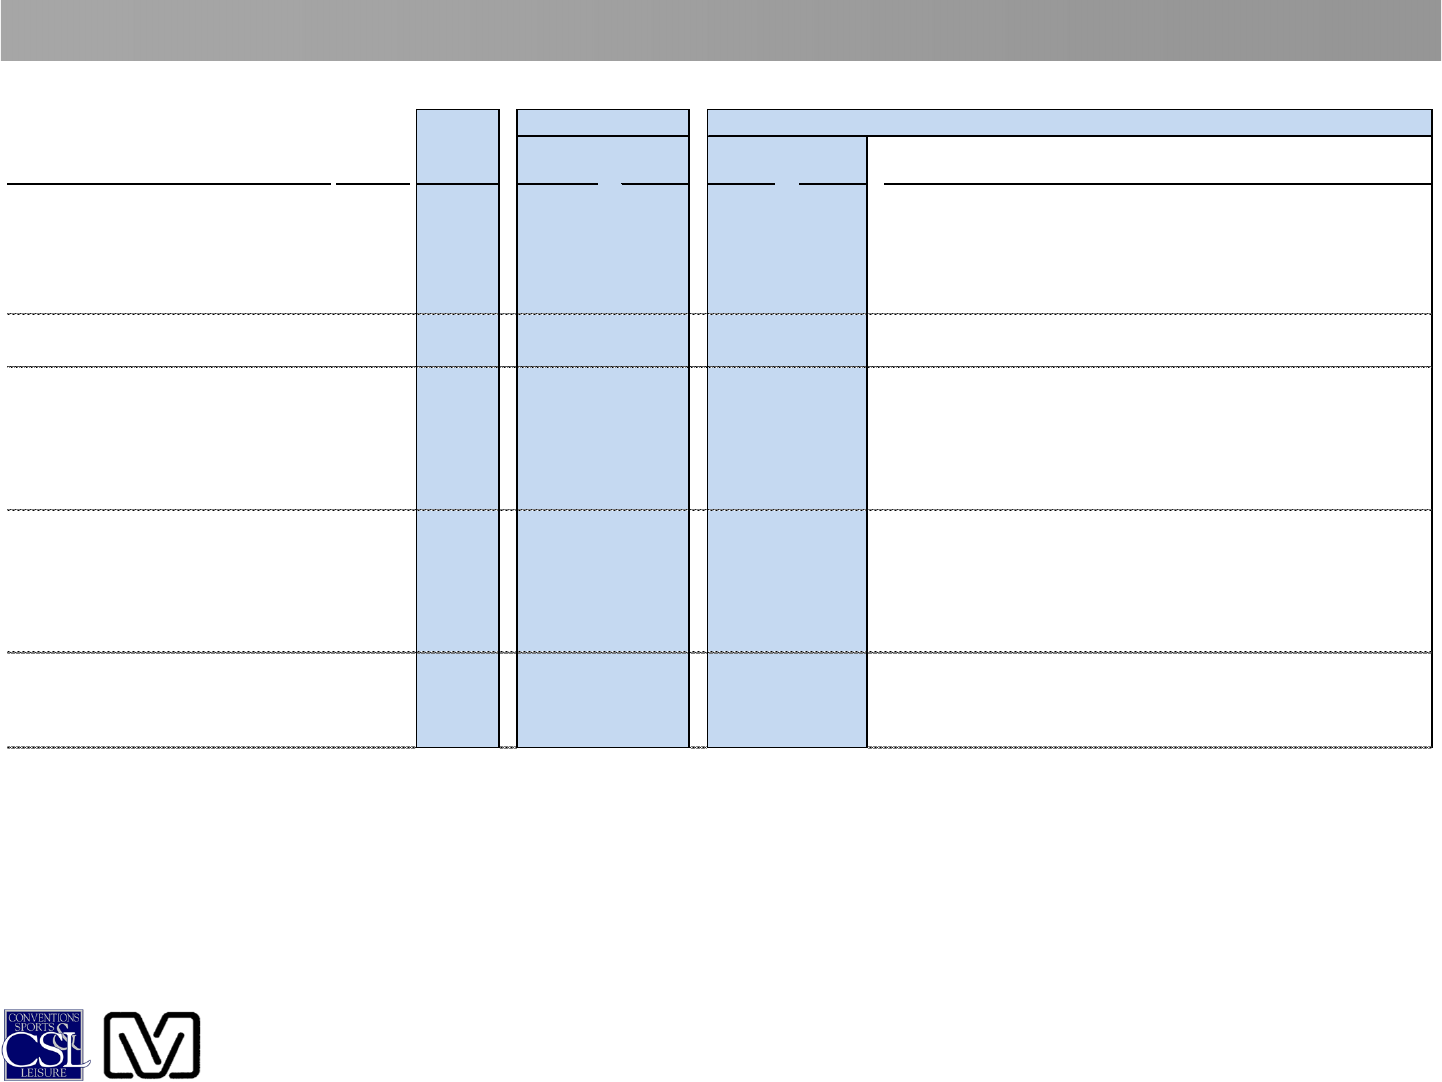
NFL STADIUM FUNDING INFORMATION
Total Private Funding
(1)
Public Funding
Year Project Total % of Total % of
Stadium/Team Opened Cost Private Total Public Total Primary Sources
49ers Stadium (Proposed) 2015 $987.0 $873.0 88% $114.0 12% 2.0% district hotel tax increase
San Francisco 49ers $42M in tax increment bonds
$17M in parking garage revenue bonds
$20M from Electric Utility Contribution
MetLife Stadium 2010 $1,600.0 $1,600.0 100% $0.0 0% N/A
New York Giants/Jets
Cowboys Stadium 2009 $1,194.0 $750.0 63% $444.0
(2)
37% 0.5% City sales tax increase
Dallas Cowboys 2.0% City hotel tax increase
5.0% City car rental tax increase
10% admissions tax
3.5% parking tax
$25 million County contribution
Lucas Oil Stadium 2008 $719.6 $100.0 14% $619.6 86% 3% Marion County hotel tax increase
Indianapolis Colts 2% County car rental tax increase
1% County restaurant tax increase
1% County admissions tax increase
1% increases in restaurant taxes in 6 other surrounding counties
Sales of Colts license plates
University of Phoenix Stadium 2006 $455.0 $147.0
(3)
32% $308.0 68% 3.25% car rental tax
Arizona Cardinals 1.0% hotel tax
State sales tax recapture
NFL-related income taxes
(1)
(2)
(3) Includes $5.0 million from the Fiesta Bow l.
Note: All dolalr figures are in millions.
The City of Arlington's contribution w as capped at $325 million. $20 million of this total w ill be repaid through Cow boys' rent payments, effectively reducing the City's contribution to $305 million. The public
funding total also includes a $25 million County contribution and $115 million from a 10% admission tax and 3% parking tax. In determining the public/private funding split, the admissions and parking tax w ere
considered to be a part of the Cow boys' contribution tow ard stadium funding. How ever, because they are taxes, for purposes of this analysis they have been considered to be public funding sources. If
these taxes w ere assumed to be private contributions, the result w ould be 65% private funding and 35% public funding.
Private funding includes team contributions, NFL G-3 loans, proceeds of seat license sales and other private investment, including pledged revenue, as detailed in the footnotes.
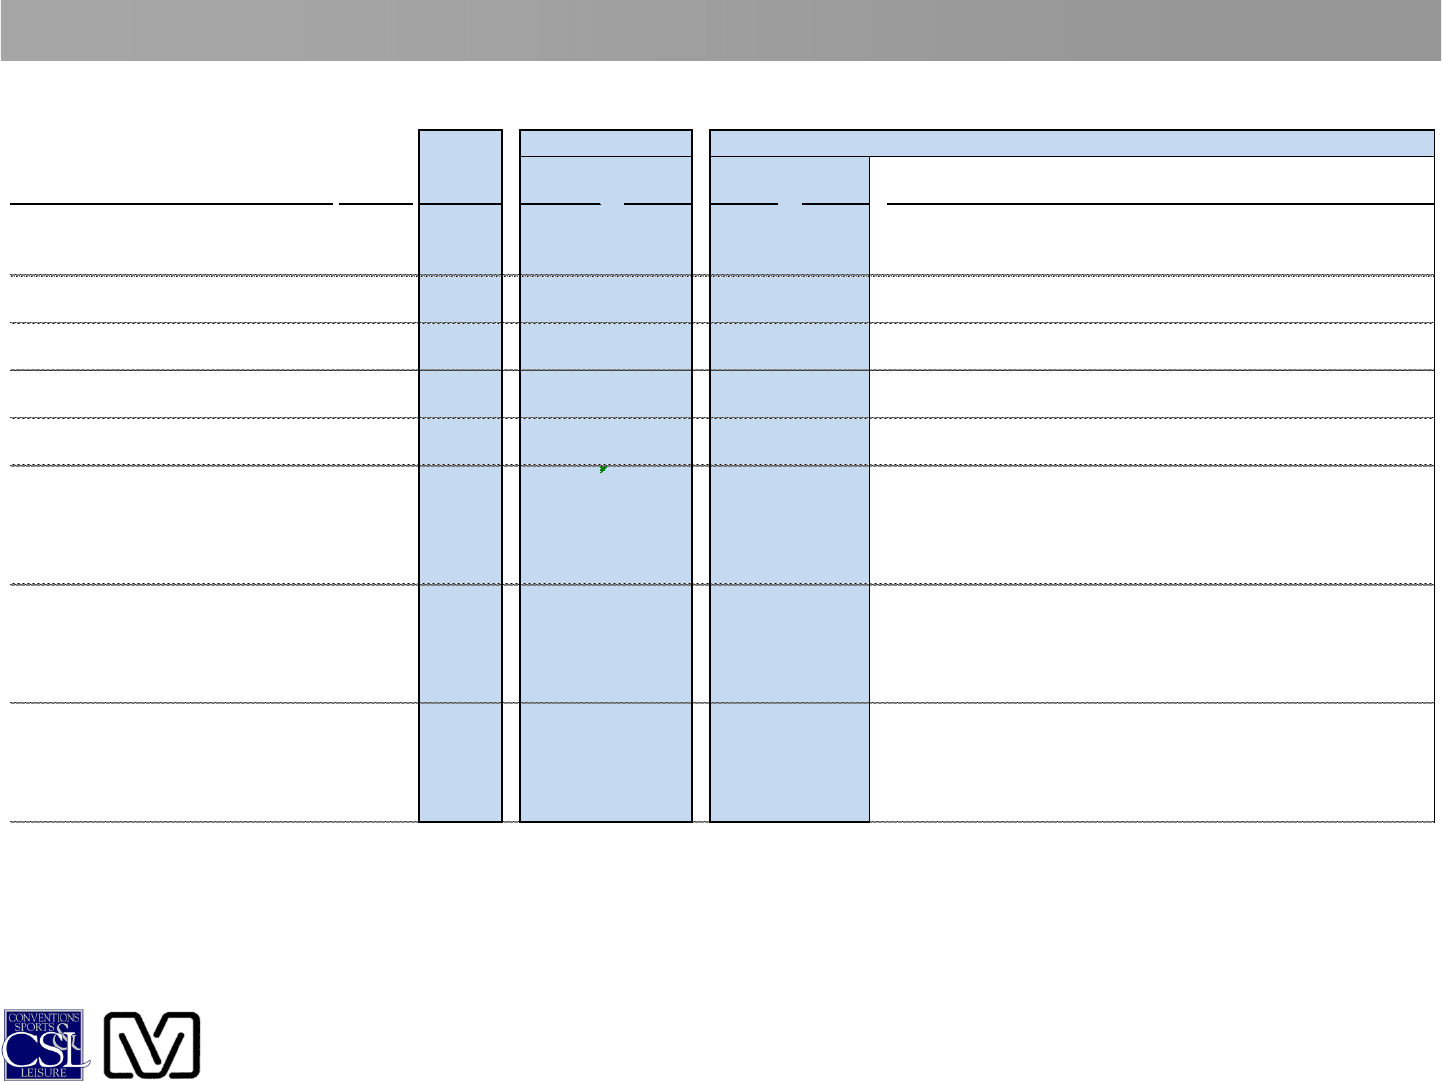
NFL STADIUM FUNDING INFORMATION
Total Private Funding Public Funding
Year Project Total % of Total % of
Stadium/Team Opened Cost Private Total Public Total Primary Sources
Lincoln Financial Field 2003 $518.0 $330.0 64% $188.0
(4)
36% State grant
Philadelphia Eagles City land acquisition
Soldier Field (renovation) 2003 $587.0 $200.0 34% $387.0 66% Allocation of existing city hotel/motel tax revenue
Chicago Bears
Lambeau Field (renovation) 2003 $295.2 $126.1
(5)
43% $169.1 57% 0.5% County sales tax increase
Green Bay Packers State infrastructure contribution
Gillette Stadium 2002 $412.0 $340.0 83% $72.0 17% State infrastructure contribution
New England Patriots
Ford Field 2002 $440.0 $330.0 75% $110.0 25% Downtown Development Authority contribution
Detroit Lions County contribution
Reliant Stadium 2002 $474.0 $185.0
(6)
39% $289.0 61% 2% increase in County hotel/motel tax
Houston Texans 5% increase in County auto rental tax
10% parking tax
$1.00 per ticket surcharge
Sales tax rebate on in-stadium spending
CenturyLink Field 2002 $461.3 $161.0 35% $300.3 65% State lottery proceeds
Seattle Seahawks Allocation of County sales taxes generated by stadium
Allocation of existing County hotel/motel tax revenue
10% admissions tax
Parking tax
Heinz Field 2001 $280.8 $109.2 39% $171.6 61% Regional Asset tax
Pittsburgh Steelers Hotel/motel tax
State and federal infrastructure funding
State grant
Ticket surcharges
(4) The Eagles receive a stadium operating subsidy, w hich is not included in the public funding contribution.
(5) Includes proceeds from a sale of Packers stock.
(6) Includes estimated value of rent payments made by the Houston Livestock Show an Rodeo that are allocated tow ard stadium funding.
Note: All dolalr figures are in millions.
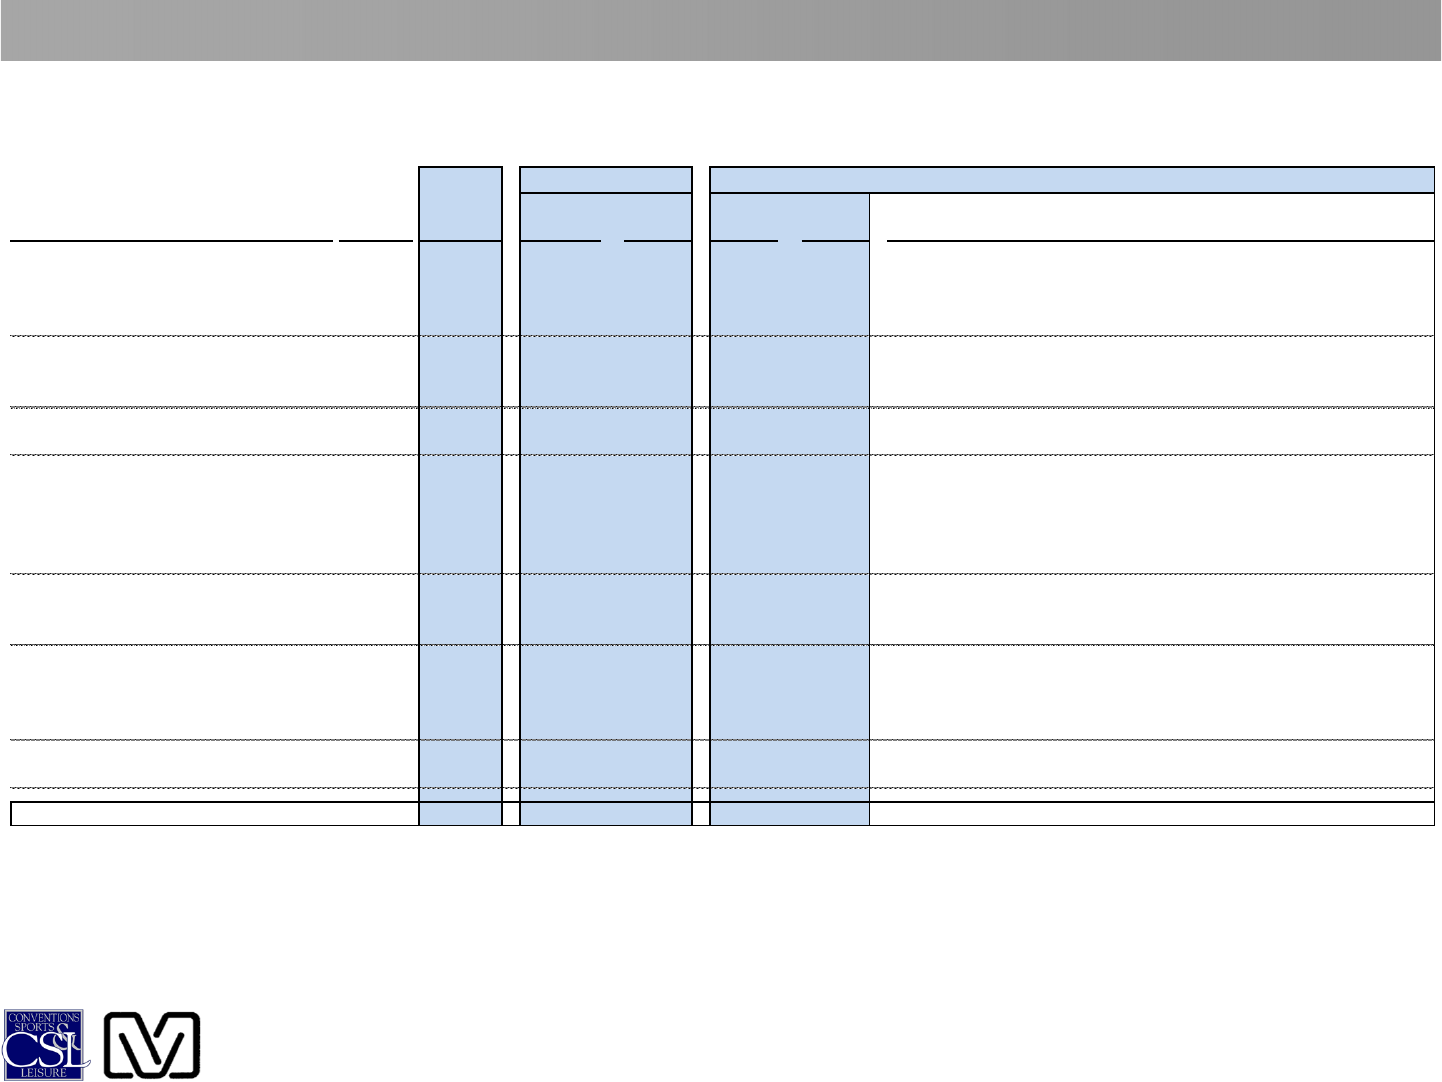
NFL STADIUM FUNDING INFORMATION
Total Private Funding Public Funding
Year Project Total % of Total % of
Stadium/Team Opened Cost Private Total Public Total Primary Sources
Sports Authority Field at Mile High 2001 $400.8 $111.8 28% $289.0 72% 0.1% multi-county sales tax increase
Denver Broncos Interest earnings
Public naming rights revenue
Paul Brown Stadium 2000 $449.8 $25.0 6% $424.8 94% 0.5% County sales tax increase
Cincinnati Bengals State grant
Interest earnings
LP Field 1999 $291.7 $84.8 29% $206.9 71% Allocations of City sales, bed and other tax revenues
Tennessee Titans State G.O. and revenue bonds
Cleveland Browns Stadium 1999 $271.0 $71.0 26% $200.0 74% State grant
Cleveland Browns City COP's
City non-tax revenue bonds
City Transit Authority
City utilities equity
M&T Bank Stadium 1998 $226.0 $22.4 10% $203.6 90% State revenue bonds
Baltimore Ravens State lottery funds
Stadium Authority revenues
Raymond James Stadium 1998 $194.0 $0.0 0% $194.0 100% 0.5% County sales tax increase
Tampa Bay Buccaneers County tourist revenue
State sales tax revenue bond
Investment income
FedEx Field 1997 $250.5 $180.0 72% $70.5 28% State infrastructure contribution
Washington Redskins
Average $525.4 $287.3 44% $238.1 56%
Note: All dolalr figures are in millions.
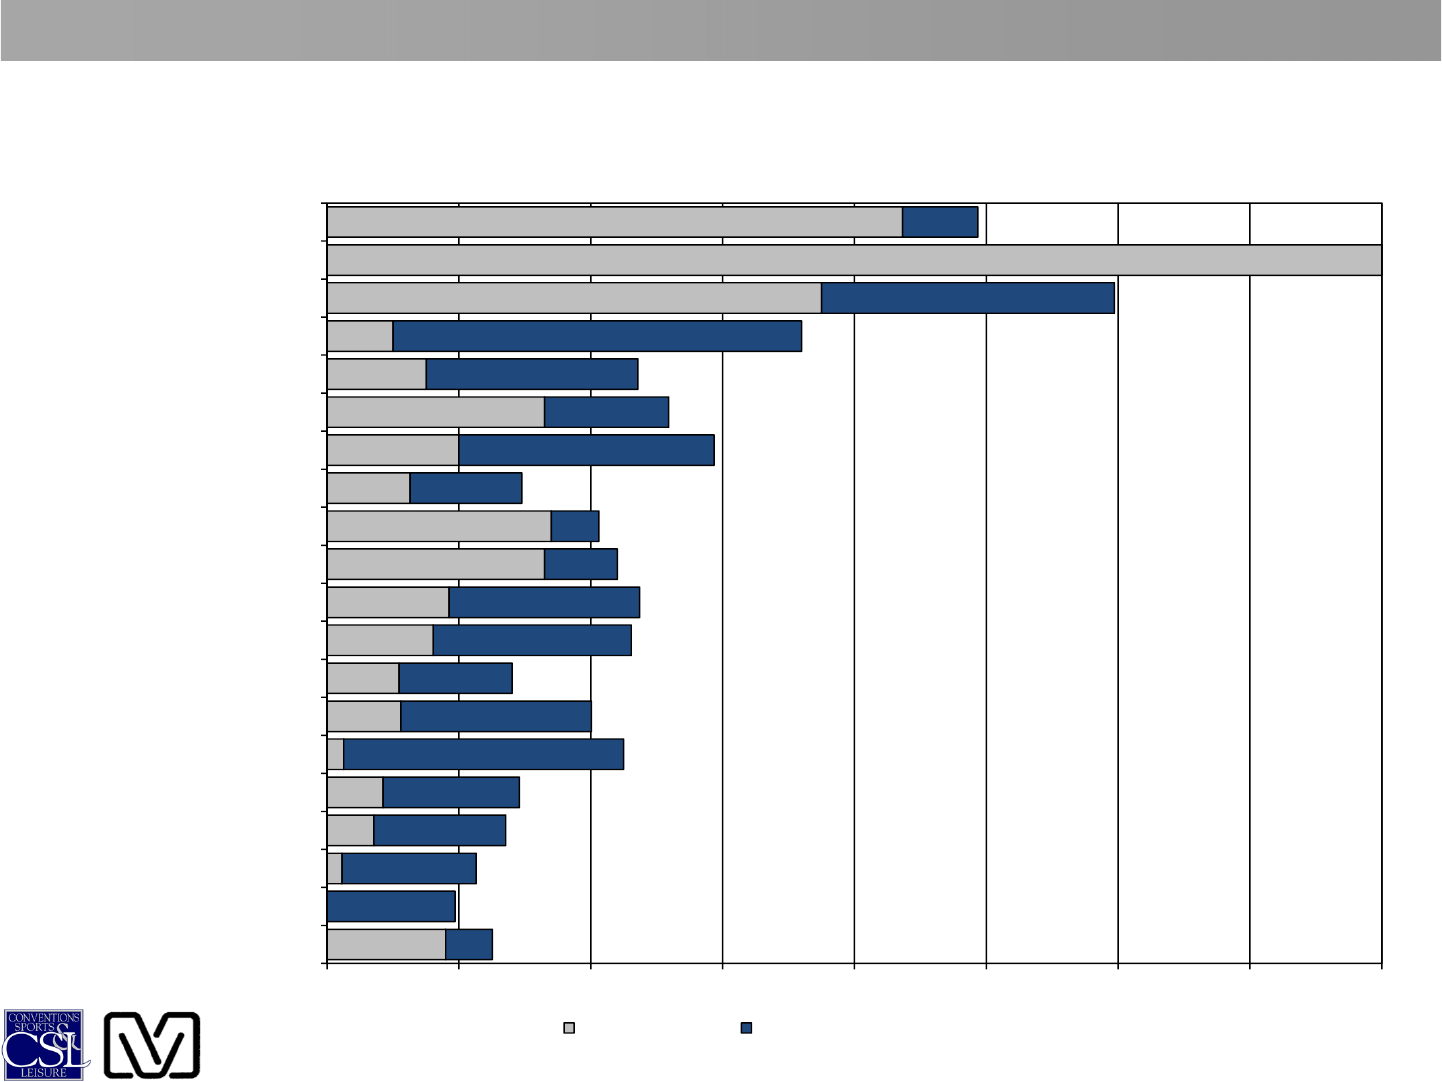
NFL STADIUM FUNDING INFORMATION
NFL Funding Contributions in Millions of Dollars
Sorted by Year Opened
$873.0
$1,600.0
$750.0
$100.0
$150.4
$330.0
$200.0
$126.1
$340.0
$330.0
$185.0
$161.0
$109.2
$111.8
$25.0
$84.8
$71.0
$22.4
$180.0
$114.0
$444.0
$619.6
$321.0
$188.0
$387.0
$169.1
$72.0
$110.0
$289.0
$300.3
$171.6
$289.0
$424.8
$206.9
$200.0
$203.6
$194.0
$70.5
$0 $200 $400 $600 $800 $1,000 $1,200 $1,400 $1,600
S.F. 49ers Proposed (2015)
NY Giants/Jets (2010)
Dallas Cowboys (2009)
Indianapolis Colts (2008)
Arizona Cardinals (2006)
Philadelphia Eagles (2003)
Chicago Bears (2003)
Green Bay Packers (2003)
New England Patriots (2002)
Detroit Lions (2002)
Houston Texans (2002)
Seattle Seahawks (2002)
Pittsburgh Steelers (2001)
Denver Broncos (2001)
Cincinnati Bengals (2000)
Tennessee Titans (1999)
Cleveland Browns (1999)
Baltimore Ravens (1998)
Tampa Bay Buccaneers (1998)
Washington Redskins (1997)
Total Private $ Total Pubilc $
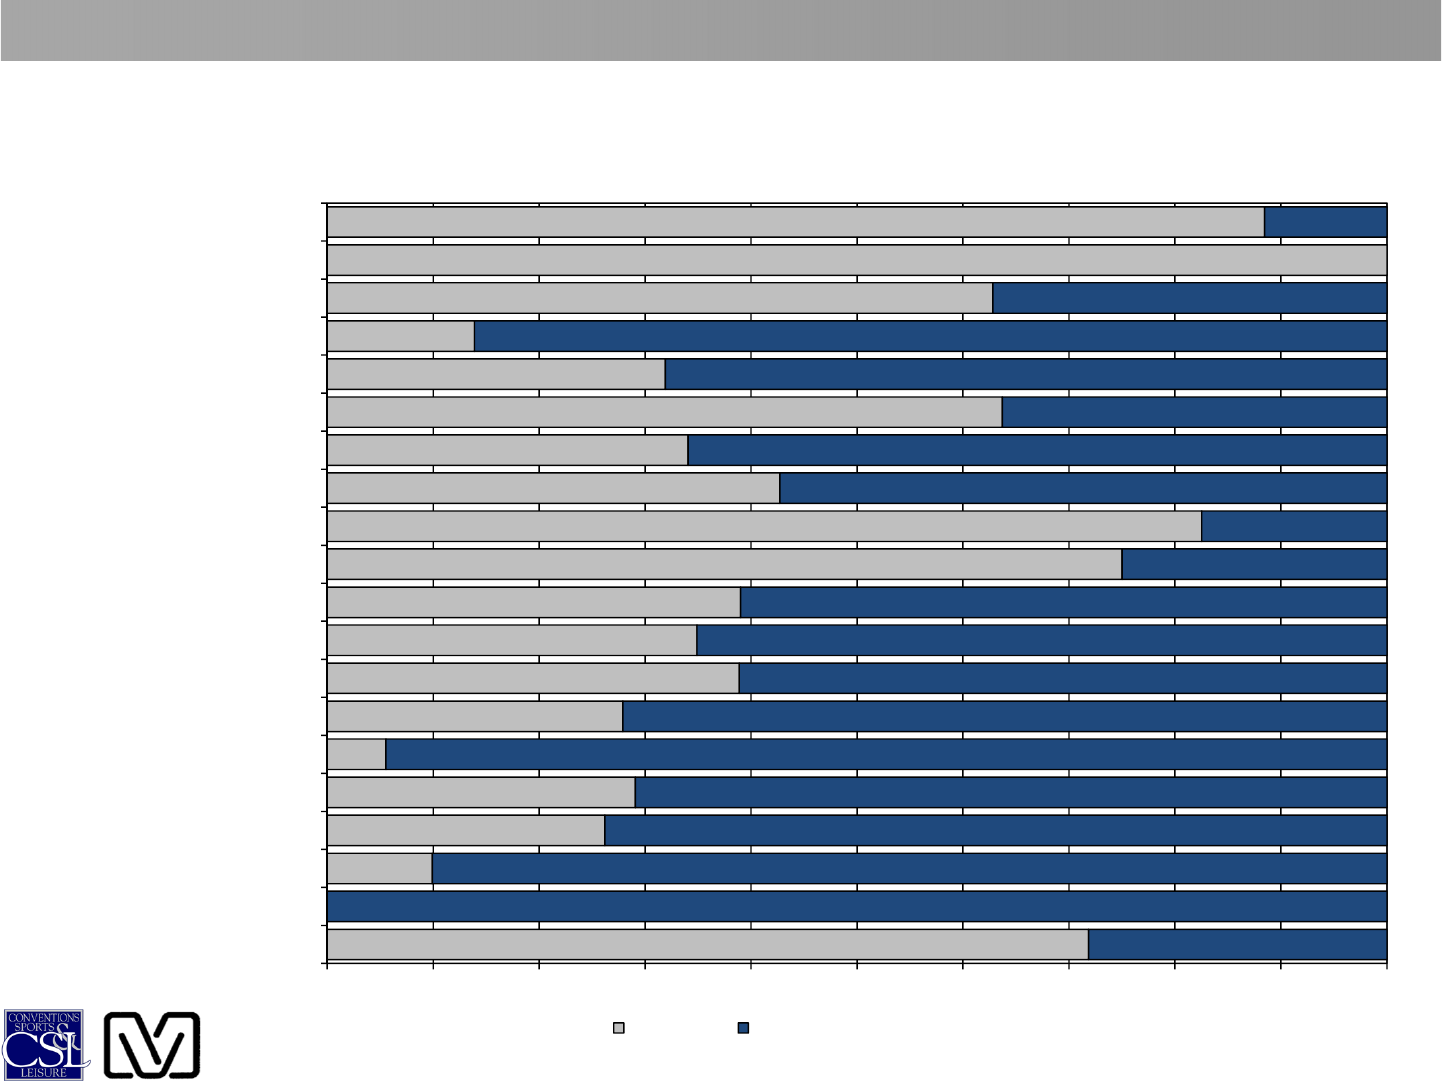
NFL STADIUM FUNDING INFORMATION
NFL Public/Private Funding Comparison
Sorted by Year Opened
88%
100%
63%
14%
32%
64%
34%
43%
83%
75%
39%
35%
39%
28%
6%
29%
26%
10%
72%
12%
37%
86%
68%
36%
66%
57%
17%
25%
61%
65%
61%
72%
94%
71%
74%
90%
100%
28%
0% 10% 20% 30% 40% 50% 60% 70% 80% 90% 100%
S.F. 49ers Proposed (2015)
NY Giants/Jets (2010)
Dallas Cowboys (2009)
Indianapolis Colts (2008)
Arizona Cardinals (2006)
Philadelphia Eagles (2003)
Chicago Bears (2003)
Green Bay Packers (2003)
New England Patriots (2002)
Detroit Lions (2002)
Houston Texans (2002)
Seattle Seahawks (2002)
Pittsburgh Steelers (2001)
Denver Broncos (2001)
Cincinnati Bengals (2000)
Tennessee Titans (1999)
Cleveland Browns (1999)
Baltimore Ravens (1998)
Tampa Bay Buccaneers (1998)
Washington Redskins (1997)
Private % Pubilc %

NFL STADIUM FUNDING INFORMATION
Public Stadium Funding Sources
• City Sales Tax
• County Sales Tax
• Lodging Tax
• Excise Tax (Alcohol, Tobacco, Gasoline, etc.)
• Car Rental Tax
• Food / Beverage Tax
• Property Tax / TIF
• Income Tax
• Utility Tax
• Lottery Funds / Gaming
• Ticket / Admission Tax
• Parking Tax
• Land Contributions
• Public Parking Revenue
• Other State / City / County Contributions
• Grant
• General Contribution
• Sale of Held Property
• Sales Tax Rebate
• Income Tax Rebate
• Operating Subsidy
• Interest-Free Loan
• Capital Fund Allocation
• Infrastructure Improvements
• Utility / Transit Allocation
